
Reports
Reports turns the operations journal into answers. Like the rest of the app, reports are computed for the store you’re working in — switch to - All Stores - for company-wide numbers.
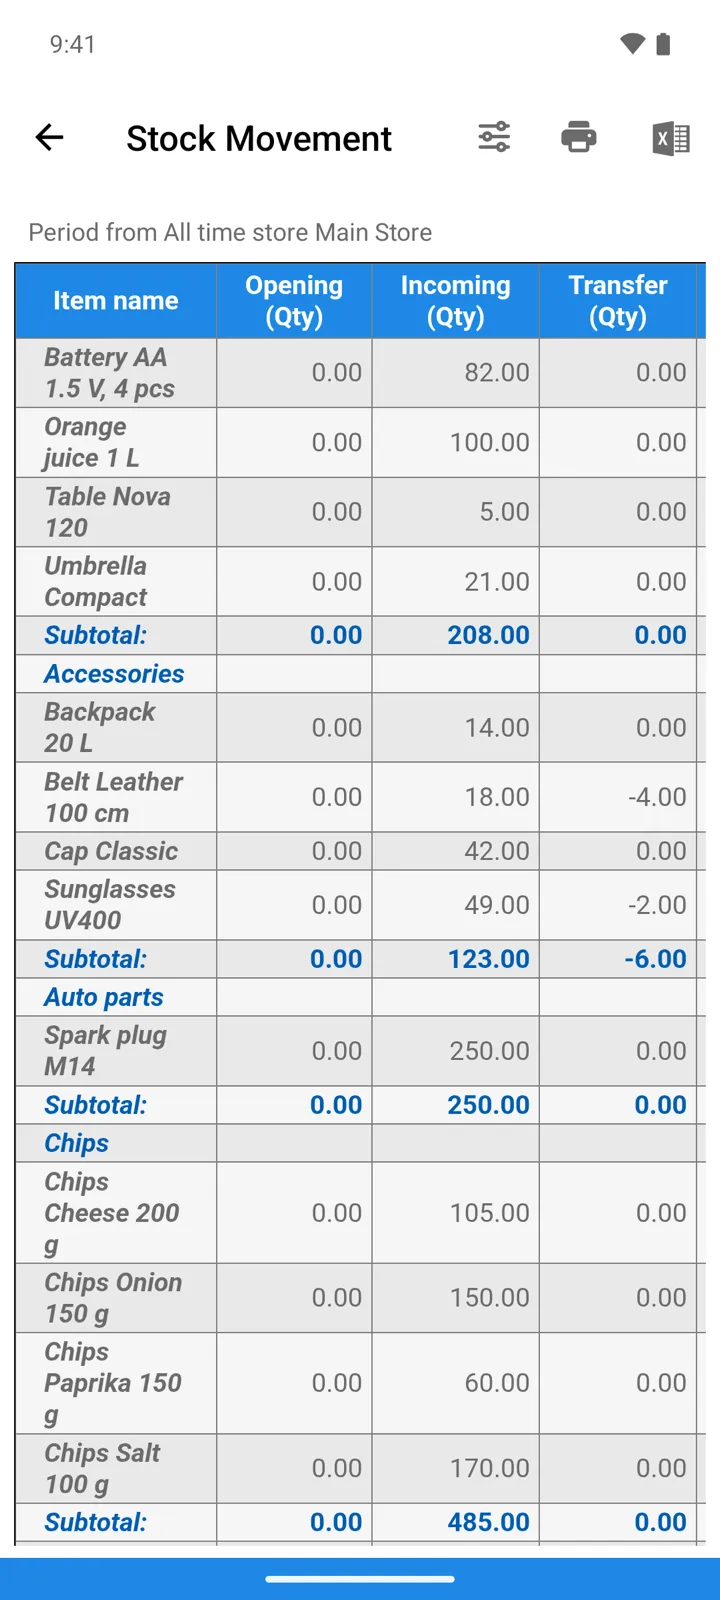
The screen
Section titled “The screen”- Tap a report to open it. The star on a row marks a favorite — favorites sort to the top of the list.
- Most reports ask for a period first: Current month, Last 30 days, Last 90 days, Current year, All time, or Set date range. Month-grid reports (such as Profits and Losses) ask for a year instead.
- A report opens as a table; many can also be viewed as a chart — pick the Chart type (Line chart, Bar chart, Pie chart) and limit the Values range.
The reports
Section titled “The reports”| Report | What it answers |
|---|---|
| Stock Movement | Each item’s story over the period: Opening quantity, then Incoming, Outgoing, Transfer, Inv.variance (stock-taking corrections), returns — and the Closing quantity. |
| Profits and Losses | Month by month: Total Purchases, Total Sales, Profit or Loss — plus Expenses and the resulting Net Profit. |
| Sales by Items | What actually sells — per item: Amount, Cost, Profit, Margin %. |
| Purchases by Items | The same cut for what you buy. |
| Sales by Month | Sales totals across a year’s months. |
| Sales by Date | Sales day by day within a period. |
| List of operations | The journal as a flat table — date, number, type, quantities and amounts. |
| List of transactions | One row per operation line — the item-level journal. |
| Purchases by Supplier | Turnover per supplier. |
| Sales by Customer | Turnover per customer. |
| Reorder Report | Items running low against their Minimum quantity — your shopping list. |
| Expenses | Spending by expense category. |
| Debts by Supplier | What you still owe, per supplier — see Payments and debts. |
| Debts by Customer | What customers still owe you. |
| Cash Book | Money in and out day by day — operation payments together with expenses. |
Exporting
Section titled “Exporting”Any report exports with Export to Excel or Export to PDF — and from there you can open, share, print, or save the file. The table’s Settings menu chooses which columns it shows.